1. Introduction
Welcome to the ICOA Advanced Guide — a deep-dive companion for competitors who have already worked through the foundational material and are ready to engage with low-level systems, binary exploitation, and reverse engineering.
1.1. About This Guide
This guide is adapted from the CTF Primer by picoCTF (Carnegie Mellon University), licensed under Creative Commons Attribution-ShareAlike 4.0. We are deeply grateful to the original authors Samuel Sabogal Pardo, Jeffery John, and Luke Jones, whose work made this material possible.
We have:
-
Curated six chapters that cover advanced and low-level topics not in the Starter Guide.
-
Preserved the original authors' technical content and voice.
-
Added an ICOA-specific introduction and a closing chapter on the ICOA competition environment.
Full attribution and the CC BY-SA 4.0 license are in the page footer and LICENSE.md.
1.2. Who This Is For
This guide assumes you have already worked through the ICOA Starter Guide (or have equivalent comfort with the Linux shell, Python scripting, networking, and basic web exploitation).
It is for:
-
Competitors preparing for harder challenges in the ICOA competition.
-
National team candidates moving from "I can solve introductory CTF challenges" to "I can analyse a binary I have never seen before."
-
Coaches assembling a curriculum for advanced training.
1.3. What’s Covered
The six chapters in this guide:
-
Tools — A consolidated index of the tools you will encounter (and which to install before the competition).
-
Reverse Engineering — The mindset and history of reversing software.
-
Assembly — x86-64 assembly, registers, and instruction-level reasoning.
-
Binary Exploitation — Stack overflows, GDB-driven debugging, memory layout, and exploitation primitives.
-
C Language — Just enough C to make binaries comprehensible.
-
Levels of Code — How source code, intermediate representations, assembly, and machine code relate.
These topics work together. C and assembly explain what binaries are; reverse engineering explains how to read them; binary exploitation explains how to break them. Read in order on first pass.
1.4. A Note on GUI Tools
Several reverse-engineering and pentesting tasks are dramatically faster with GUI tools (IDA, Ghidra, Burp Suite, Wireshark). The Tools chapter lists where to get them. The bulk of the technical content in this guide, however, uses CLI tools (gdb, objdump, readelf, strings) — the same toolchain available in the ICOA competition environment.
A future ICOA tutorial will cover GUI workflows in depth. For now, this guide focuses on the CLI fundamentals you can practise inside the ICOA competition environment.
1.5. How to Use This Guide
Read it once, slowly, with a terminal open. Type out every example. The skills here are not learned by reading — they are learned by doing.
Let’s begin.
2. Tools
Jeffery John
Throughout this Primer, we’ve recommended a number of tools to help you get started with hacking. Here they are, all in one place. Where applicable, the ICOA practice environment at practice.icoa2026.au will pre-install the CLI variants of these tools.
2.1. General
-
ICOA Practice Environment:
practice.icoa2026.au(registered competitors) -
Git: https://git-scm.com
2.2. Forensics
-
The Sleuth Kit: https://www.sleuthkit.org/sleuthkit
-
Wireshark: https://www.wireshark.org
-
ASCII Table: https://www.asciitable.com
-
Pwntools: http://docs.pwntools.com/en/stable
2.3. Web Exploitation
-
W3 Schools: https://www.w3schools.com
-
Burp Suite: https://portswigger.net/burp
2.4. Cryptography
-
Vigenère Cracking Tool: https://www.simonsingh.net/The_Black_Chamber/vigenere_cracking_tool.html
-
Extended Euclidean algorithm: https://planetcalc.com/3298
-
Integer factorization calculator: https://www.alpertron.com.ar/ECM.HTM
2.7. Git
-
Git: https://git-scm.com
-
Git Cheat Sheet: https://education.github.com/git-cheat-sheet-education.pdf
-
Oh My Git!: https://ohmygit.org
-
GitHub: https://github.com
3. Levels of Code
Jeffery John
Throughout this Primer, we have discussed programming languages like Python, JavaScript, SQL, PHP, and C.
We have tried to introduce these languages in the ways that they are used most often in cybersecurity, but each can do many of the things that the others can do. It is just as possible to run a web server in Python, as it is to write regular expressions in JavaScript.
What does set these languages apart is the level of abstraction that they provide. This is a concept that is important to understand when working with code, and especially when working with reverse engineering.
Abstraction in programming is about how much the author has to think about the underlying hardware. To the end user, it’s unlikely to matter or be noticed. For cybersecurity, we want to be conscious of what vulnerabilities may be hidden in these abstractions.
3.1. High-level Languages
High-level languages are the most abstract. They are meant to be easy to read by other developers and fast to code in. They are also meant to be portable, which means they can be run on many different kinds of hardware like your desktop, phone, or server.
These languages are often used to write applications or scripts, due to their ease of use. Since many programs do not need to be used by anyone other than the developer, it makes sense that developers often choose a language that is easiest for them.
Some examples of high-level languages are Python, Nim, and Perl.
In order for these languages to work, they need to be translated into a lower-level language. This is done by a compiler or interpreter. Here are some comparisons between high-level languages:
print("Hello World!")echo "Hello World!"print "Hello World!\n";Each of these examples does the same thing, but the syntax is a bit different. This is because each language has its own rules and conventions. However, a computer is still able to execute the code in the same way because of the translation to a lower level like machine code.
If the developer is not confident, a high-level language can also protect them from accidentally writing insecure code that may be vulnerable to attacks like buffer overflows. These can be avoided in low-level languages, but the abstraction and easier syntax of high-level languages can help prevent these mistakes.
3.2. Low-level Languages
Low-level languages are less abstract than high-level languages. They are meant to be fast and easy for the computer to understand, not necessarily the developer.
These languages are often used to write operating systems, drivers, and other software that needs to interact with the hardware.
Some examples of lower level languages are C, Assembly, and Rust. We say lower level here, and not low level, because abstraction is also a relative concept. Assembly may be more direct to hardware than C, but C is lower level than Python. For comparisons between lower level languages:
#include <stdio.h>
int main() {
    printf("Hello World!\n");
    return 0;
}
section .data
hello db 'Hello, world!',0
section .text
global _start
_start:
mov eax, 4
mov ebx, 1
mov ecx, hello
mov edx, 13
int 0x80
mov eax, 1
xor ebx, ebx
int 0x80fn main() {
println!("Hello, world!");
}Compared to the higher level languages, these are a bit more verbose for us as readers and developers. However, to the computer and hardware, not much has changed. We just see more of the details that were abstracted away by features in the higher level languages.
These languages will also need to be translated into machine code for the computer to run, but they can execute faster because they can take advantage of hardware features and optimizations that interpreters may not be able to.
3.3. Intermediate Representation (IR)
Intermediate Representation (IR) allows for interpreters and compilers to work with code in a way that is more abstract than machine code, but less abstract than high-level languages.
This can lessen the gap between high and low level languages, and allow for some optimizations and other features that are otherwise not possible in high-level languages. IR is often used for applications that may be run on many different kinds of hardware, like web browsers. Rather than compiling the code several times, the IR can be optimized for multiple types of hardware, and the code will only need to be translated once to an IR.
Some examples of IR are LLVM and WebAssembly. These can be useful when reverse engineering, as IR can be easier to work with and understand than raw machine code.
3.4. Assembly & ISA’s
We have touched on assembly language before when considering C. Assembly is even less abstract than C, and consists of instructions that are directly translated to machine code. When writing in assembly, a developer has to consider the architecture of the hardware that the code will be run on, as each has its own set of instructions. This can be impractical for most applications, but is necessary for some software that needs to be as fast as possible.
ISA, or Instruction Set Architecture, is the set of instructions that a particular hardware architecture can understand. This is what assembly language is written in, and is what the compiler or interpreter will translate high-level languages into.
Some examples of ISA’s are x86, ARM, and MIPS. When reverse engineering these, a hacker will need to understand how the assembly code will differ between what they may be familiar with.
3.5. Machine Instructions
Finally, machine instructions are the lowest level of code, and have no abstraction. These are the instructions that the hardware can understand, and are what the compiler or interpreter will ultimately translate the code into.
These instructions are often represented in hexadecimal, and are not meant to be read by humans. It is still possible to access these instructions with tools like debuggers and hex editors, but it would be difficult to understand what is happening without a deep understanding of the hardware and the ISA.
With each level of code, abstractions can take shortcuts that may be exploited by attackers. For example, a high-level language may have a feature that is meant to make it easier to work with strings, or a low-level language may have a feature that is meant to make it easier to work with memory, but these both may have vulnerabilities that can be exploited.
4. A little about C language
Samuel Sabogal Pardo
We could say that C is one of the oldest programming languages that is still widely used in industry. It was developed in 1972 by the famous Dennis Ritchie, and even after all these years, is in fact one of the most used languages. This is the case because it is very efficient and we can control very directly the resources of the machine, in contrast to other languages, such as python. However, it is a more difficult language to learn to use it correctly, and it is much more prone to errors and vulnerabilities. Even experienced programmers that have written a lot of C in their lives can make a little mistake and introduce a bad vulnerability in a program that a hacker can exploit to take complete control of the machine in which the program is running.
Nonetheless, many people still love C. We can use it to implement programs that need to be very efficient, such as the Operating Systems, Drivers (the programs that control the hardware of devices that we connect to our computer), or Embedded Systems. You will probably not hear about an Operating System, or a Driver, fully implemented on python, at least any time soon.
4.1. Some C features
Keep in mind the following aspects of C:
-
In C you can access directly an address of memory, and move through it with a pointer even if you don’t have a variable that is stored there.
-
C is very prompt to vulnerabilities, as we already mentioned. We will learn to exploit those vulnerabilities. C is harder to learn and write than python, because you need to clearly understand how the memory interacts with your program.
-
It is not indented as python to determine the lines of code inside a function, loop, clause, etc. For example, the lines of code inside an 'if clause', are determined by braces, not four spaces. This is an 'if clause' in python and C respectively:
if x>5:
    print "Hello"
Now, the same in C, would look like (the 'f' at the end of print is necessary):
if(x>5)
{
    printf("Hello");
}
But in C, we could do:
if(x>5)
{
printf("Hello");
}
And it would work. But it is important you do not write it like that if you begin to do programming in C, because a program can become very unreadable. Always use indentations on C, even if they are not mandatory.
-
In C, you do comments using '//', instead of '#' as in python. For example, the same comment in python and C, would be:
#This is a comment in python //This is a comment in C-
You can compile C for different platforms. Compiling means the process of translating the programing language to machine code. A computer does not understand directly the source code you write. A compiler is a program that reads your source code and converts it to a binary that your computer can execute. The instructions in that binary are harder to read for a human in comparison to the source code. Those instructions that the processor understands directly are called machine code. When the programs is compiled, you do not need any additional program to execute it besides the operating system. In contrast, when you run a python program, to execute it, you need the python interpreter.
-
Since C is so direct to the machine, people often say that it is like a portable Assembly. Assembly, as we will see later, is a language that is used to manipulate the instructions of the processor in your machine. Assembly changes depending on the kind of processor you are using. For example, Intel processors understand a different Assembly language than ARM processors. However, you could write the same program in C and it could work on both, because you can compile it either for ARM or for Intel.
-
In languages like python, we do not compile the program, because python has an interpreter that translates line by line when it is being executed. That makes it slower, by a fair amount. You can do an experiment by implementing a for loop that calculates something on each iteration, and compare the result between python and C, and you will note that a python loop takes much longer than a C loop that calculate the same.
4.2. C Hello World!
Let’s get hands on now! Open a Linux shell (the ICOA practice environment at practice.icoa2026.au once available, or any local Linux/WSL session with gcc installed).
Create a folder called 'c_examples' using:
mkdir c_examplesGo inside the folder using:
cd c_examplesNow, create a file called "my_c_example.c" in this file, we will write the C code. You can create the file with:
nano my_c_example.cInto that file, write the following code, which will print "Hello World!"
#include <stdio.h>

int main() {
   printf("Hello World!\n");
   return 0;
}
Note that this line:
#include <stdio.h>Is used to import a library, which is a set of functions, that allows us to read and write from the terminal in our program. This:
printf("Hello World!");Is the function printf, which we can use to print strings in the terminal. The function main:
int main() {
}
Is the function that wraps the code of our program. Note that in C, the content of function is enclosed in braces {}. By convention, main is the function that would be executed in our program, even if we don’t call it. In C, functions return a data type. In this case, main returns an 'int', which means integer. That is why we see the word 'int' right before 'main'. This line:
return 0;Is our main function returning the integer 0. When the main function returns, that marks the end of our program.
Now save the program. Remember that in the nano editor, you save the program by pressing in your keyboard 'control' and 'x' at the same time. Now, to compile our program, we will use 'gcc' which is a very famous compiler; 'gcc' means 'GNU Compiler Collection'. To compile the program, run:
gcc my_c_example.cYou will see no output on the screen if it compiled correctly. However, if you list the contents of your current folder using:
lsYou should see a new file created, called 'a.out'. The is your new executable binary! You can run it using:
./a.outYou should see printed the message 'Hello World!' on the screen. Note that we can execute the binary with no additional program, as we had to do with python, in which we needed the python interpreter, hence we wrote 'python' before the name of our program.
What if we want to give a name to our binary when we compile it? We can do:
gcc my_c_example.c -o my_binaryIf you list the contents of your folder using:
lsYou should see the file 'my_binary' listed. You can run it using:
./my_binaryAnd it will show 'Hello World!' as it did before.
4.3. C data types
Before proceeding to do more interesting programs, let’s stop to learn the data types in C. In python, you can create a variables without specifying the data type. However, in C, you need to specify it. These are fundamental data types in C:
-
char: It is the data type for allocating a single character. In most of the compilers, it takes only one byte. Note that we can store any number on it, it does not have to be an actual character. Remember that a character in a computer is a number too. Since it is one byte, it can represent 256 values. As you know already, one byte is made up of 8 bits. So, 2^8 is equal to 256.
-
int: It is an integer type. We can place on it an integer number, but can be much bigger as the char, because an int uses four bytes. Therefore, we can place on it, roughly, four billion values (2^32).
-
float: This data type is used to store decimal numbers. In other words, numbers with a floating point value. They also take four bytes. But since they are decimals, is not that easy to show how many possible values stores. It is a finite number of possible values of course. But for now, just know it is used for storing numbers with decimals. Since we are on a computer, the precision is limited. A float can have at most 7 decimals!
-
double: It is used to store decimal numbers but with double precision, so it can have at most 15 decimals. It takes 8 bytes.
In C, you could have the following code using those data types:
#include <stdio.h>
int main() {
    char a='p';
    int b = 12345;
    float c = 1.123456;
    double d = 1.012345678912345;
    printf("\n my char: %c ", a);
    printf("\n my int: %i ", b);
    printf("\n my float: %f ", c);
    printf("\n my double: %.16g \n\n", d);
    return 0;
}
Create the file 'print_data_types.c':
nano print_data_types.cAnd put the previous code on it. Compile it with:
gcc print_data_types.c -o print_data_typesAnd run it with:
./print_data_typesYou should see the following output:
 my char: p
 my int: 12345
 my float: 1.123456
 my double: 1.012345678912345
We just saw how to print different data types. Things to note:
-
%c is used to output a character. You can have it in any position of the first string you pass as argument to printf. You can also have it in several places if you pass more characters like this:
printf("\n my char %c , my second char %c , my third char %c ",a,a,a);-
%i is used to print an integer.
-
%f to print a float.
-
%.16g is to print a float but we can specify the number of decimals we want, in this case 16, but we could change that number.
An important thing to note, that we already mention, is that a character is just a number that is interpreted as such. Do the following experiment: use %i instead of %c to print the character 'p' in our program. What number do you see and why that number?
Answer: You should have seen 112. That happens because 112 is the ASCII of 'p', as we can see in the ASCII table:
4.4. C pointers
When you need to store a list of integers, you could use a buffer of memory to do it, which is just a chunk of empty memory that can be filled with the integers you need. For example, suppose we need to store a list of 5 integers and the print the whole list. We could do something like the following:
#include <stdio.h>
int main()
{
    int arr[5];
    arr[0]=11;
    arr[1]=12;
    arr[2]=13;
    arr[3]=14;
    arr[4]=15;
    for(int i=0;i<5;i++)
    {
        printf("\n Array value at position %i: %i \n",i, arr[i]);
    }
}
In the line 'int arr[5];' we are declaring an array of 5 integers. So the program allocated a buffer of 20 bytes, because each integer takes 4 bytes. Then we assign an arbitrary integer to each of the positions, and then we print them on a loop.
In C, the first line of a for loop is made up of three parts: In the first one, you can declare a variable and set its starting value. That is 'int i=0' in our code. The second part is the condition; the loop will keep iterating as long as that condition is met. In our code the condition is 'i<5'. The third part is generally a modification you do so the loop advances. In this case we increment i by 1. Note that in C this:
i++;Is exactly the same as this:
i=i+1;Inside our loop, we print our counter 'i', and the current value at position in 'i' in the array. Put that code in a file using:
nano print_array.cCompile it:
gcc print_array.c -o print_arrayRun it:
./print_arrayYou should see as the output:
 Array value at position 0: 11
 Array value at position 1: 12
 Array value at position 2: 13
 Array value at position 3: 14
 Array value at position 4: 15
So far, everything seems to work fine. But now, add the following line after the for loop:
printf("\n Array value at position 7: %i \n", arr[6]);You might be thinking that line would cause an error, because we don’t even have a seventh position in our array. However, it will not! Compile again and run the code. Remember to always compile. If you are used to python, you might forget that step. Do not forget it! The code looks like this:
#include <stdio.h>
int main()
{
    int arr[5];
    arr[0]=11;
    arr[1]=12;
    arr[2]=13;
    arr[3]=14;
    arr[4]=15;
    for(int i=0;i<5;i++)
    {
        printf("\n Array value at position %i: %i \n",i, arr[i]);
    }
    printf("\n Array value at position 7: %i \n", arr[6]);
}
And the output, should look, somewhat, like this:
 Array value at position 0: 11
 Array value at position 1: 12
 Array value at position 2: 13
 Array value at position 3: 14
 Array value at position 4: 15
 Array value at position 7: 1695902208
What is going on here? We did not even have a 7th position. Our array is actually only 5 positions in size. This is something bad. What is happening, is that C does not actually have real arrays with size as other languages do. It is merely a chunk of memory. In this case, our variable 'arr' is just a pointer to the first byte of that chunk of memory. When we do, for example, arr[2], we are pointing to the first byte of the chunk of memory plus 8 bytes, because each integer has 4 bytes, so we move in memory to point to the place in which is stored the third position. You will understand this better as you advance in binary exploitation and understand how variables are placed in memory. For now, just know that C allocates the memory needed to place a buffer, but does not have any control that prevents you accessing the wrong place. In our example, 1695902208 is value from our program that is 8 bytes away from the spots in which or array should be stored, it could be other variable. Many people claim that C does not have real arrays, because as you saw, it is just a chunk of memory.
In C, you can create not only variables, but also pointers to variables. A pointer simply stores the address in which a variable is located in memory. Now that you can read few lines of C, it is better to explain a program using the comments on C to explain the things that might be new to you. So, let’s take a look at the following program that illustrates pointers in an easy manner. Pay close attention to the comments. Create a file, paste that code, compile it, and run it as you already know how to. The following program might seem a bit long, but it is because it has several prints so you can understand what is happening. Is very easy to read. This is the program:
#include <stdio.h>
int main() {
    //we declare a char:
    char c='S';
    //We declare a pointer to char, for that we use the *
    char *p;
    //Assign address of the char c, to pointer p. To get the address of a variable we use &
    p=&c;
    printf ("\n This is the value of char c: %c ", c);
    //As we said, we use & to get the address. We are printing the memory address in which c is located:
    printf ("\n This is the address of char c: %d ", &c);
    printf ("\n This is the address that pointer p is pointing at, which is the address of c: %d ", p);
    //we use * to get the content in the address we are pointing at
    printf ("\n This is the content of the address that pointer p is pointing at, which is the value of c: %c ", *p);
    printf ("\n This is the address of the pointer (a pointer has to be located somewhere as well as any variable): %d ", &p);
    //
    //Now, we can use pointers to point to the first character of an array of characters, and move through it
    char *p2 ;
    //We use malloc to allocate 6 bytes
    p2 = malloc(6);
    printf ("\n This is the address that pointer p2 is pointing at %d ", p2);
    //Note: memory allocated with malloc, is allocated in the heap, so you see
    //that its value is far from the other values we have printed that were local
    //variables and are allocated in the stack. You will learn more about the stack and heap later.
    //p2 is pointing to memory in the heap, but it's a local variable, so if we print
    //its address it should be close to the other local variables:
    printf ("\n This is the address of  p2: %d ", &p2);
    //Now we assign values to the bytes we have allocated:
    *(p2+0)='h';
    *(p2+1)='e';
    *(p2+2)='l';
    *(p2+3)='l';
    *(p2+4)='o';
    *(p2+5)=0;
    printf("\n This is p2 printed as a string: %s ",p2);
    //Note that 0 (the ASCII for NULL), is the end of the string.
    //Also note that 0 is different from '0', '0' is actually 48, if you print it as an int
    printf("\n This is the value of the zero char, different from null char: %d ",'0');
    //See what happens if we put a 0 in the middle of our char array:
    *(p2+2)=0;
    printf("\n This is the string we just created: %s ",p2);
    //It prints only "he"
    //
    //Of course a string can be created in a shorter way, for instance:
    char *p3=&"hello";
    printf("\n This is the content pointed by p3: %s ", p3);
    //
    //Now, let's make a pointer to pointer to char, we will use the pointer p that points to the char c we declare previously
    char **pp;
    pp=&p;
    //So, imagine pp is a box (the first box), that contains an address that points to a second box, that contains an address that points to a third box, that contains a char
    printf("\n This is the address in which pp is allocated, the address of the first box: %d ", &pp);
    printf("\n This is the address  pp points at, the content of the first box: %d ", pp);
    printf("\n This is the content of the second box: %d ", *pp);
    printf("\n This is the content of the third box: %c ", **pp);
    //we can create as many pointers to pointers as we need:
    char ***ppp;
    ppp=&pp;
    printf("\n This is the content of ***ppp: %c ", ***ppp);
    //
    //To explain why this could be useful, we will quote a StackOverflow post that is cool, from user pmg, https://stackoverflow.com/questions/5580761/why-use-double-pointer-or-why-use-pointers-to-pointers
    //
    //"If you want to have a list of characters (a word), you can use char *word
    //If you want a list of words (a sentence), you can use char **sentence
    //If you want a list of sentences (a monologue), you can use char ***monologue
    //If you want a list of monologues (a biography), you can use char ****biography
    //If you want a list of biographies (a bio-library), you can use char *****biolibrary
    //If you want a list of bio-libraries (a ??lol), you can use char ******lol
    //yes, I know these might not be the best data structures" pmg
    //
    //Let's see how we could implement a list of words
    char **pp2=malloc(100);
    //pp is the first address
    *pp2=&"hi";
    *(pp2+1)=&"carnegie";
    *(pp2+2)=&"mellon";
    printf("\n This is hi: %s ", *pp2);
    printf("\n This is carnegie: %s ", *(pp2+1));
    printf("\n This is mellon: %s ", *(pp2+2));
    //You might be wondering about the relation between arrays and pointers. Some people say in c, the use of [] is just syntactic sugar.
    //But there are not actual arrays on C.
    //In this expression it is created a pointer to the first element of the array. In fact, arr is pointer to the first element:
    char arr[5]="hello";
    //these expressions are the same:
    printf("\n This is arr[0]: %c ", arr[0]);
    printf("\n This is *arr: %c ", *(arr+0));
    //as well as:
    printf("\n This is arr[1]: %c ", arr[1]);
    printf("\n This is *(arr+1): %c ", *(arr+1));
    printf("\n This is arr[2]: %c ", arr[2]);
    printf("\n This is *(arr+2): %c ", *(arr+2));
    printf("\n This is arr[3]: %c ", arr[3]);
    printf("\n This is *(arr+3): %c ", *(arr+3));
    printf("\n This is arr[4]: %c ", arr[4]);
    printf("\n This is *(arr+4): %c ", *(arr+4));
    //understanding that, you can see now why in C, a thing that looks very weird as the following, makes sense:
    printf("\n This is 1[arr]: %c ", 1[arr]);
    //As you see, it printed 'e', because that expression is just *(1+a), which is the same as *(a+1)
    //People says that proves that in C there are not actual arrays. What is our opinion? As long as you clearly
    //understand how it works in the languages you are using
    printf("\n SEE YOU!  keep on the good work! \n ");
}
At this point you should know the commands for creating a file, compile it, and run it, but just in case:
nano pointers.c
gcc pointers.c -o pointers
 ./pointers
Note that the compilation shows several warnings, because we did things, for the sake of the example, that are not good practice.
With this introduction to C, you will be able to begin to read the source code from challenges and clarify new things you see along the way on Google. Now it is approaching the real fun of binary exploitation!
5. Assembly
Samuel Sabogal Pardo
We previously saw in binary exploitation how some registers work and how the memory of a program is allocated. Once you get some idea of how to do basic binary exploits, to enter in a more advance level it is useful to understand the assembly in more detail. There are several assembly languages and they are exclusive to the processor architecture of a computer. Processor architectures have specific instructions. For example, an Intel processor can execute different instruction than an ARM processor, hence, the assembly language for ARM is different than the one for Intel. To begin, we will be using Intel assembly just for the fact that Intel architecture is widely used. The webshell, and your computer probably, have an Intel architecture. Note that the AMD processors have the same architecture and instruction set as Intel. Smartphones, in contrast to most laptops or desktops computers, generally have an ARM processor.
Intel is CISC (Complex Instruction Set Computer); that implies that it has much more instructions than ARM which is RISC (Reduced Set Instruction Computer). However, we will only be exploring some instruction in intel that are common and useful to know. It would be too dense to begin to explain instructions independently. Instead, let’s make a program and begin to understand it. Assembly is not easy to abstract at the beginning, but once you learn a few things, it becomes very intuitive and it is possible to read assembly to understand the logic of a program in an architecture you never saw before because it has similar patterns. Therefore, we encourage you to keep trying on this part even if it seems not easy to grasp at the beginning.
Outside Resource: OpenSecurity x86-64 Training is an excellent free course on Intel assembly.
5.1. Registers
We will show in this part, for reference, the most relevant registers from Intel Architecture for an example of a program in assembly we will introduce. The Intel registers are broken down in several categories. They include General Registers, Segment Registers, Index/Pointer Registers, and Flags registers. For now, it is good to see the purpose of each of the registers in two of those categories.
5.2. General Registers
Note that in the General Registers, when we are using processor of 64 bits, the register name begins with R. In a 32 bits processor, the register name begins with E, and in 16-bit architecture, it does not have a prefix and the name is only two letters. For example, there is a 16-bit register called AX. In 32 bits, we have the same register for the same purpose, but it can hold 32 bits, and it is called EAX. In 64 bits, that same register is called RAX. We can use a 16-bit or 32-bit register in a 64-bit architecture, but not the other way around. Each register is conventionally used for some specific operations, but they can be used for other purposes. These are the General Registers in 16, 32, 64 bits: RAX,EAX,AX (Accumulator register): It is usually used to place the return value of a function but can be used for other purposes.
RBX,EBX,BX (Base register): Used as the base pointer for memory access. We subtract or add an offset to the value of this register to access variables.
RCX,ECX,CX (Counter register): Usually used as a loop counter.
RDX,EDX,DX (Data register): Usually used to store temporary data in operations.
Note that in a 64 bits program, the conventions can change. For example, in a 32-bit architecture we generally pass the arguments of a function in the stack, while in 64-bit programs we pass them in registers in many cases. For now, do not worry about those details. Focus on getting a sense on how assembly works when we show the example of a program in assembly.
5.3. Index/Pointer Registers
These registers are used to mark the end or start of a region of memory to allow a program keeping track of elements such as location of variables or the top of the stack, which are essential to manipulate data in memory.
RSP,ESP,SP (Stack pointer register): Indicates the top of the stack. Whenever we create a local variable, this pointer changes to allow space to that variable. For example, if we create an variable that takes 4 bytes, the stack pointer moves 4 bytes to make room for that new variable.
RIP,EIP,IP (Instruction Pointer): Indicates the current instruction that the program is executing. If we make this register pointing to an address, the program will execute the code at that address.
RBP,EBP,BP (Base pointer register): Indicates the beginning of the stack frame of a function. The stack frame is a region of memory in which we place data, such as local variables, from a specific function. To access a local variable from a function, we take the address of the base pointer and subtract an offset.
RDI,EDI,DI (Destination index register): Generally used for copying chunks of memory, that can be strings or arrays.
RSI,ESI,SI (Source index register): Similar purpose to the previous register (Destination index register).
5.4. Assembly example
Now, let’s dive into the assembly of a program!
Open a Linux shell with gcc and gdb installed (the ICOA practice environment at practice.icoa2026.au will have these pre-configured).
Compile the following program:
#include <stdio.h>
int main( ) {
   int i;
   printf( "Enter a value :");
   scanf("%d", &i);
   if(i>5){
       printf("Greater than 5");
   }else {
       printf("Less or equal than 5");
   }
   return 0;
}
To do that you can create a file with:
nano example.cPaste the code in that file, save it with control+x, and then compile the file with:
gcc example.c -o exampleRun it to verify its functionality with:
./exampleYou can obtain the assembly of a compiled program without having the original source code with the following command:
objdump --disassemble exampleThat will output the assembly of the compiled program ‘example’ on the terminal. You can redirect that output to a file, which in this case we call dump.txt, using:
objdump --disassemble example > dump.txtThat assembly dump has many things. For now, we will focus only on the assembly of the function ‘main’. We can dump the assembly of a specific function, in this case ‘main’, in the following manner:
gdb -batch -ex 'file example ' -ex 'disassemble main'Also, you can run the program on GDB like this:
gdb exampleSet a break point on main:
(gdb) b main
Breakpoint 1 at 0x71e
And run the program:
(gdb) r
Starting program: /home/your_user/example
Breakpoint 1, 0x000055555555471e in main ()Breakpoint 1, 0x0000555555555189 in main ()
Since the program execution stopped at main, you can do ‘disas’ to obtain the assembly from ‘main’:
(gdb) disas
Dump of assembler code for function main:
   0x000055555555471a <+0>:	push   %rbp
   0x000055555555471b <+1>:	mov    %rsp,%rbp
=> 0x000055555555471e <+4>:	sub    $0x10,%rsp
   0x0000555555554722 <+8>:	mov    %fs:0x28,%rax
   0x000055555555472b <+17>:	mov    %rax,-0x8(%rbp)
   0x000055555555472f <+21>:	xor    %eax,%eax
   0x0000555555554731 <+23>:	lea    0xfc(%rip),%rdi        # 0x555555554834
   0x0000555555554738 <+30>:	mov    $0x0,%eax
   0x000055555555473d <+35>:	callq  0x5555555545e0 <printf@plt>
   0x0000555555554742 <+40>:	lea    -0xc(%rbp),%rax
   0x0000555555554746 <+44>:	mov    %rax,%rsi
   0x0000555555554749 <+47>:	lea    0xf4(%rip),%rdi        # 0x555555554844
   0x0000555555554750 <+54>:	mov    $0x0,%eax
   0x0000555555554755 <+59>:	callq  0x5555555545f0 <__isoc99_scanf@plt>
   0x000055555555475a <+64>:	mov    -0xc(%rbp),%eax
   0x000055555555475d <+67>:	cmp    $0x5,%eax
   0x0000555555554760 <+70>:	jle    0x555555554775 <main+91>
   0x0000555555554762 <+72>:	lea    0xde(%rip),%rdi        # 0x555555554847
   0x0000555555554769 <+79>:	mov    $0x0,%eax
   0x000055555555476e <+84>:	callq  0x5555555545e0 <printf@plt>
   0x0000555555554773 <+89>:	jmp    0x555555554786 <main+108>
   0x0000555555554775 <+91>:	lea    0xda(%rip),%rdi        # 0x555555554856
   0x000055555555477c <+98>:	mov    $0x0,%eax
   0x0000555555554781 <+103>:	callq  0x5555555545e0 <printf@plt>
   0x0000555555554786 <+108>:	mov    $0x0,%eax
   0x000055555555478b <+113>:	mov    -0x8(%rbp),%rdx
   0x000055555555478f <+117>:	xor    %fs:0x28,%rdx
   0x0000555555554798 <+126>:	je     0x55555555479f <main+133>
   0x000055555555479a <+128>:	callq  0x5555555545d0 <__stack_chk_fail@plt>
   0x000055555555479f <+133>:	leaveq
   0x00005555555547a0 <+134>:	retq
End of assembler dump.
Note that the instructions on an Intel processor can be represented with two types of syntax. There is the AT&T syntax, which is the one we just printed, and there is the Intel syntax. Note that the syntax is different from architecture of the processor. Here we are on the same processor, which is Intel architecture, but we can use AT&T syntax or Intel syntax. To print intel syntax on GDB, we can do:
(gdb) set disassembly-flavor intelIf you run ‘disas’ again, you will see the same main function, but in Intel syntax:
(gdb) disas
Dump of assembler code for function main:
   0x000055555555471a <+0>:	    push   rbp
   0x000055555555471b <+1>:	    mov    rbp,rsp
=> 0x000055555555471e <+4>:	    sub    rsp,0x10
   0x0000555555554722 <+8>:	    mov    rax,QWORD PTR fs:0x28
   0x000055555555472b <+17>:	mov    QWORD PTR [rbp-0x8],rax
   0x000055555555472f <+21>:	xor    eax,eax
   0x0000555555554731 <+23>:	lea    rdi,[rip+0xfc]        # 0x555555554834
   0x0000555555554738 <+30>:	mov    eax,0x0
   0x000055555555473d <+35>:	call   0x5555555545e0 <printf@plt>
   0x0000555555554742 <+40>:	lea    rax,[rbp-0xc]
   0x0000555555554746 <+44>:	mov    rsi,rax
   0x0000555555554749 <+47>:	lea    rdi,[rip+0xf4]        # 0x555555554844
   0x0000555555554750 <+54>:	mov    eax,0x0
   0x0000555555554755 <+59>:	call   0x5555555545f0 <__isoc99_scanf@plt>
   0x000055555555475a <+64>:	mov    eax,DWORD PTR [rbp-0xc]
   0x000055555555475d <+67>:	cmp    eax,0x5
   0x0000555555554760 <+70>:	jle    0x555555554775 <main+91>
   0x0000555555554762 <+72>:	lea    rdi,[rip+0xde]        # 0x555555554847
   0x0000555555554769 <+79>:	mov    eax,0x0
   0x000055555555476e <+84>:	call   0x5555555545e0 <printf@plt>
   0x0000555555554773 <+89>:	jmp    0x555555554786 <main+108>
   0x0000555555554775 <+91>:	lea    rdi,[rip+0xda]        # 0x555555554856
   0x000055555555477c <+98>:	mov    eax,0x0
   0x0000555555554781 <+103>:	call   0x5555555545e0 <printf@plt>
   0x0000555555554786 <+108>:	mov    eax,0x0
   0x000055555555478b <+113>:	mov    rdx,QWORD PTR [rbp-0x8]
   0x000055555555478f <+117>:	xor    rdx,QWORD PTR fs:0x28
   0x0000555555554798 <+126>:	je     0x55555555479f <main+133>
   0x000055555555479a <+128>:	call   0x5555555545d0 <__stack_chk_fail@plt>
   0x000055555555479f <+133>:	leave
   0x00005555555547a0 <+134>:	ret
End of assembler dump.
In AT&T syntax, there are several differences. One of them that is notorious, is that you see the symbol % all around, which is used to prefix registers. Also, in some operations the position of arguments is different. Keep in mind this to prevent confusion. We will explain the program using Intel syntax, following each line of the assembly code. Remember from the binary exploitation section, that the hexadecimal number we observe at the left, for example this ‘0x000055555555471a <+0>:’, is the memory address in which that instruction of assembly is located on RAM. In the first line of assembly we see in the main function is the following (we removed the address shown at the left for simplicity):
push rbpWe observe the instruction ‘push rbp’. As we know already, rbp is the base pointer, which is a register used to keep track of the part of the stack in which the local variables of a function begin to be stored. In this case, the current value of the rbp is pushed into the stack, to be able to recover it later. This is an important part of a function that allow us to keep the value of the base pointer from the previous function. For example, suppose you have a function call inside another function, like in the following example in which we call func2 from func1:
void func2(){
	char var4;
	char var5;
	char var6;
}
void func1(){
	char var1;
	char var2;
	char var3;
	func2();
}
The piece of memory in which are stored the variables of a function is called the stack frame. In assembly we do not have variable names, instead, we have the rbp pointing to the memory address in which begins the stack frame of a function. For example, if the program is currently executing func2, the three variables declared in func2, could look like the following in memory:
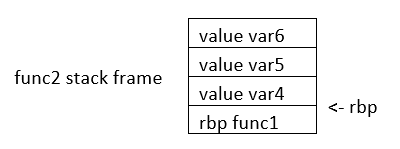
If we want to access the value of var6, we do rbp minus 3. Note that if we subtract three positions from rbp, we would be pointing to var6. As you can see, accessing variables in assembly is not complicated, we just need to subtract from rbp some positions to point to the variable we want. However, we just have one register in the processor to keep the value of the base pointer. So, what we do, is pushing into memory the value of the base pointer from the previous function. That is the “rbp func1” that you see in the memory from the previous image. We store the rbp from a previous function, as we store a local variable, to be able to recover it later when we come back to func1 and be able to access the variable from func1. We explained all that to point out what was this line for:
push rbpIn that line of assembly, we are storing the previous value of the rbp, to later restore it when we return from the current function. The instruction push, places the value of a registry into memory, and subtracts the size of the register to the stack pointer. In an Intel processor of 64 bits, a register is 8 bytes. So, when we do ‘push rbp’, it is automatically subtracted 8 to the stack pointer.
In the second line:
0x000055555555471b <+1>: mov rbp,rspWe assign the stack pointer value to the base pointer. Mov, in Intel syntax, assigns the value of the operand at the right side to the operand at the left side. In this case, rsp (stack pointer), is the operand at the right side, and rbp (base pointer) is the operand at the left. Such an assignment is done, because at the beginning of a function the stack pointer is pointing to the beginning of the stack frame. When push variables in a function, the stack pointer will move, because the stack pointer will be pointing always to the last variable pushed. Then, in the line:
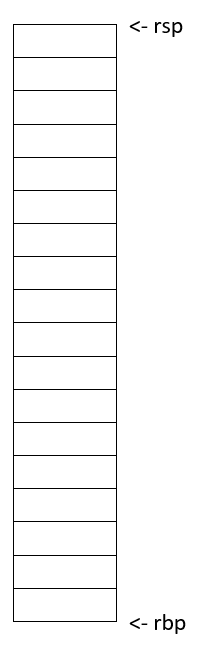
sub rsp,0x10We are subtracting 16 bytes from the stack pointer. Note that the prefix ‘0x’ is used to denote a hexadecimal number. 10 in hexadecimal is 16 in decimal. In Intel syntax, the instructions ‘sub’ subtracts the operand at the right side to the operand on the left side. In this case, we subtract 10 from rsp. That subtraction is done to allocate 16 bytes on the stack. We will assign values in those bytes later. So far, we have something like the following, in which we have 16 bytes allocated:
Then in this line:
mov rax,QWORD PTR fs:0x28We are assigning FS:0x28 to the register rax. QWORD PTR, means that is a pointer to a QWORD. A QWORD simply means a variable of 8 bytes. FS:0x28 contains something called the stack canary, which is a random value used to mitigate the risk of buffer overflow attacks. If that value is overwritten, the program will detect an attack or error and terminate. Then in this line:
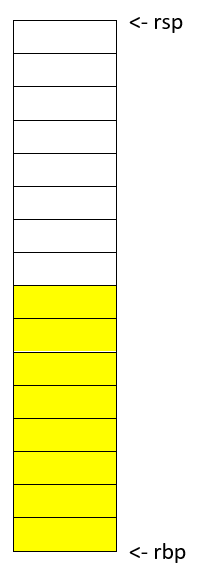
mov QWORD PTR [rbp-0x8], raxWe are assigning the value of rax, which currently has the stack canary, to rbp-0x8. Note that rbp-0x8 is located in the memory chunk of 16 bytes we previously allocated. So, we are placing the stack canary in the first part of the stack frame of the main function. In the following image the stack canary is colored in yellow:
In assembly, we cannot assign directly the contents of a memory address into other memory address. We must read the contents of the memory address into a register and then assign that register to the other memory address. That’s why rax was used. In this line:
mov eax,0x0We are assigning 0 to the lower 32 bits of the rax register. In other words, eax are the lower 4 bytes of the rax register which is 64 bits. Then, the line:
xor eax,eaxIs used to make eax equal to zero. XOR is exclusive OR. When you XOR a variable with itself, the result is always zero. This is a property of the XOR operation.
Afterwards in this line:
lea rdi,[rip+0xfc] # 0x555555554834We are assigning to rdi the string that contains the message "Enter a value :" in our program. The instruction ‘lea’ assigns the address in the square brackets. In contrast, mov assigns the content that is located in that address. The string "Enter a value :" is located in rip+0xfc. Note that GDB gives us an indication of what is the value of rip+0xfc, as a comment at the right that shows 0x555555554834. In the current GDB session you started, run the following command to print the string at that address:
print (char*) 0x555555554834You will see as output:
$2 = 0x555555554834 "Enter a value :"In this line:
mov eax,0x0We are setting eax to 0. Note that there are not square brackets, because of that, mov assigns the value at the right side directly, and not the content in the address 0. We need to set eax to zero because this is the number of floating-point arguments (FP args) that we will be passed to printf, which we are about to call. So, we are indicating we are not passing any floating-point numbers to printf. Note that we have already set eax to zero doing the XOR. Sometimes, compilers generate assembly that a human could optimize further. In this line, we finally call printf, with the string "Enter a value :" as the argument :
call 0x5555555545e0 <printf@plt>Afterwards, we are calling scanf. Remember that in C, we called scanf like this:
scanf("%d", &i);In assembly, the next line we are executing is this:
lea rax,[rbp-0xc][rbp-0xc] is the address of a local variable, remember that rbp is the base pointer. In assembly we subtract an offset to the base pointer to access the local variable we want. In [rbp-0xc] is located the variable we declared in C as ‘int i’. In other words, [rbp-0xc] is the address of ‘I’. Then we have:
mov rsi,raxIn which we assign rax to rsi. The register rsi is the source index register, which determines where the information read from the keyboard goes in scanf. Since we assign the address of ‘i’ to that register, the user input will be assigned to ‘i’.
The following line calls scanf, with the arguments that are already set:
call 0x5555555545f0 <__isoc99_scanf@plt>This line:
mov eax,DWORD PTR [rbp-0xc]Assigns the content at [rbp-0xc], to eax. By now, [rbp-0xc], which is the spot that stores the value of the variable ‘i’ we declared on C, already has the value that the user input. So, eax currently has the value that the user input.
The line:
cmp eax,0x5compares eax to 5. The result in that comparison is placed in flags that we do not see in the source code and belong to a register called the control register. Those flags are the carry flag, sign flag, overflow flag, and zero flag. Assembly automatically uses them to represent the result of a comparison.
Then, in the following line:
jle 0x555555554775The instruction jle means Jump if Less or Equal. So, if in the result of the previous comparison eax was less than or equal than 5, the execution of the program jumps to the address 0x555555554775. You may have different addresses in your assembly if you compiled it on your own, but the instructions are the same. In the assembly from the example, at address 0x555555554775, we have the following lines ( note that we kept the addresses at the left of the instructions so you can verify the address you jumped to):
   0x0000555555554775 <+91>:	lea    rdi,[rip+0xda]        # 0x555555554856
   0x000055555555477c <+98>:	mov    eax,0x0
   0x0000555555554781 <+103>:	call   0x5555555545e0 <printf@plt>
Those lines will print the message "Less or equal than 5" in a similar manner we printed a message before. Then, the next lines after the call of printf, are:
   0000555555554786 <+108>:	    mov    eax,0x0
   0x000055555555478b <+113>:   mov    rdx,QWORD PTR [rbp-0x8]
   0x000055555555478f <+117>:	xor    rdx,QWORD PTR fs:0x28
   0x0000555555554798 <+126>:	je     0x55555555479f <main+133>
   0x000055555555479a <+128>:	call   0x5555555545d0 <__stack_chk_fail@plt>
   0x000055555555479f <+133>:   leave
   0x00005555555547a0 <+134>:	ret
In the first of those lines which is:
mov eax, 0x0We make eax zero. Then we have:
mov rdx, QWORD PTR [rbp-0x8]That line accesses rbp-0x8, which contains the value of the stack canary. We assign that value to rdx. Then at this line:
xor rdx,QWORD PTR fs:0x28We xor the rdx with fs:0x28. In an XOR operation, if the two elements we operate are equal, the result is zero. Then, in this line:
je 0x55555555479f <main+133>‘je’ means jump if equals. If the result of the XOR is zero, which would set the flags as if a comparison was equal, we jump to 0x55555555479f. What we are doing at a general level in the last lines, is taking the stack canary from our stack frame. Remember that the stack canary was previously stored there. Now we compare it with the original value of the stack canary at fs:0x28. If the value is the same, it means that the chunk of memory which was holding the stack canary in the stack frame was never overwritten. If it was never overwritten, we do a jump to skip this line:
0x000055555555479a <+128>: call 0x5555555545d0 <__stack_chk_fail@plt>Which calls a function that indicates that the protection was violated. Note that the ‘jmp’ instruction jumps without verifying any condition. In the last two lines of the program:
   0x000055555555479f <+133>:   leave
   0x00005555555547a0 <+134>:	ret
The instruction ‘leave’ restores the old value of the EBP that was stored in the stack. As we explained, the ebp from the previous function that called the current function is stored in the stack. Then, ‘ret’ pops the return address from the stack and redirects the execution of the program to that address. Note that a program can redirect its execution to other address by assigning that address to the rip (instruction pointer). The instruction ‘ret’ automatically pops an address from the stack and assigns it to the instruction pointer.
That is the end of the ‘main’ function! Stay tuned for more content on Assembly and in the meantime checkout this great online course on the topic!
6. Reverse Engineering
Reversing finds the most important parts of software quickly and understands them deeply. Though it is a specific and rare set of skills, there are a myriad of ways to use the knowledge it yields. One may exploit software or fix it, create malware or exterminate it, bypass protections or enhance them. A good reverser understands the aspects of software that the authors did not expect anyone else to understand, and a master reverser understands things about software that even the authors of it know nothing about.
| In the context of CTF’s, reversing typically means analyzing a software artifact to discover its vulnerabilities, hidden information, or dormant functionality. |
The next section covers the definition and history of the discipline in much more depth. Feel free to skip that section, and go straight to our consideration of the most common high-level goals for reverse engineering, or go straight to the next section to get into the details of common challenges in reversing.
6.1. Linguistics, Etymology & our Predecessors
| Optional section. BLUF: Reversing has existed for centuries and has always meant deconstructing something man-made to understand it better. |
I’m a bit of a history buff and I greatly enjoy the origins of words as well. This section started with finding a good definition of "reverse engineering," but inevitably, it dredged up more than just that!
I may have marked this section optional, but if I did not think it was important, I would not have written it at all. Understanding the origin of the term and how those who have gone before us practiced the discipline is not an exercise in optimizing proficiency in modern reversing techniques but rather an exercise in understanding what is possible when applying an ancient discipline to a new medium, and perhaps avoiding some pitfalls that our predecessors did not.
|
On the Reliability of Wikipedia
It is important to note that while Wikipedia is not a great source for
say, a history paper, it tends to very often be an excellent source of
knowledge for sciences, esp. "arcane" ones like computer security. Of course,
even for these subjects, using the Wikipedia article’s sources are even better
still!
|
I think Wikipedia’s definition of "reverse engineering" is really good. Dictionary definitions I’ve seen tend to create different definitions for reverse engineering machines versus software. The Wikipedia article at the time of this writing captures both well. I have paraphrased it below:
Reverse engineering is the process by which a man-made object, entity, or artifact is deconstructed to reveal its designs, architecture, or to extract knowledge.
6.3. Profiles of Reversers
As intimated in the introductory paragraph to reversing, in spite of how specific reverse engineering skills are, there are many ways in which these skills can be used and for very different goals. The next secitons cover some of the most common profiles for reverse engineering in the world of software. Although there are different goals for each profile, the means to them is the same: gaing deeper understanding of software by reverse engineering.
7. Binary Exploitation
Samuel Sabogal Pardo
Get ready for binary exploitation. We use C to explain binary exploitation because it is a language very prone to have vulnerabilities, however, other languages have similar vulnerabilities.
7.1. A hack example!
A hack is not necessarily a cyberattack. It is just a clever way to do something, in our context, on a computer. For example, how would you make a program to print the smallest of two numbers without using an if statement? This sounds complicated when you first hear it, but look at the following bit hack! Make a small program in C copying this code:
#include <stdio.h>
int main(int argc, char **argv)
{
    int x=9;
    int y=5;
    int result=y^((x^y)&-(x<y));
    printf("this is the smallest number %d \n", result);
    return 0;
}
That was fantastic! What is happening here? Keep in mind the results of the following operations:
AND
1 & 0 = 0
0 & 0 = 0
1 & 1 = 1
0 & 1 = 0
XOR
1 ^ 0 = 1
0 ^ 0 = 0
1 ^ 1 = 0
0 ^ 1 = 1Now, we have y=5, x=9.Let’s analyze each part of:
y ^ ( ( x ^ y ) & - ( x < y ) )
In the part highlighted in bold:
y ^ ( ( x ^ y ) & - ( x < y ) )
x < y is false, in c false is represented as a 0, that in a byte would look like this: 00000000
-0, is 0, so it keeps being 00000000
So, -( x < y ) is 0. So far we would have
y ^ ( ( x ^ y ) & 0 )
Now
y ^ ( (x^y) & 0 )
( x ^ y ) & 0 is 0 , because any value & 0, is still 0
So we get to
y ^ ( 0 )
This is simply y ^ 0 , when you take any value and do XOR with zero, it is like doing nothing!
So we get to y which is the smallest number (cool!!!!!!)
But what happens if the values of x and y are swapped, surely it will not still print the smallest number? Swap the values in your code, compile and run it again to see what happens!
That was amazing. That is a beautiful hack! It is actually called a bithack! In a computer, this operation executes much faster than an "if" statement. In most of the programs you don’t need to execute an operation that fast to comply with the functionality you need, but in some cases that is needed.
Let’s say that a hack could be simply a clever thing. Now, what is an exploit?
It is an attack on a computer program. If a computer program has a vulnerability, a hacker can take advantage of such a vulnerability to make the program do something different from the original purpose of the program. Taking advantage of a vulnerability successfully, it is called an exploit.
7.2. Stack overflow attack
By this point you should already know how to use the terminal, compile programs and have some understanding of C programming. Create the following program in the webshell, and name it vuln1.c:
#include <stdio.h>
#define BUFSIZE 4
void win()
{
    puts("If I am printed, I was hacked! because the program never called me!");
}
void vuln()
{
    puts("Input a string and it will be printed back!");
    char buf[BUFSIZE];
    gets(buf);
    puts(buf);
    fflush(stdout);
}
int main(int argc, char **argv)
{
    vuln();
    return 0;
}
You can see that the function win() is never called in the program. Therefore, the message that it prints should never be printed. right?
Compile the program using:
gcc vuln1.c -o vuln1 -fno-stack-protector -no-pie
Now run the program using:
./vuln1
You can input a string, and it will print it back. For instance, if you input "HelloPicoCTF", it should show:
Input a string and it will be printed back!
HelloPicoCTF
HelloPicoCTF
The program did what it was written for. Now, we are going to send a particular string to the program using python. You can run a single line of python in the command using the flag -c, and enclosing the line of code between single quotes. In the terminal you can pass the output of one command as the input to other command using the pipe, which is this character "|". In the following command we are printing something in python, and passing that to the C program we just compiled.
python3 -c 'print("hello world!")' |./vuln1You should see "hello world!" printed back to the terminal right after the command. Note that in python you can repeat the same character if you multiply it by a number, so 128*"A" is simply a string composed by 128 "A" repeated. For example if you run:
python3 -c 'print(10*"A")'You should see the output:
AAAAAAAAAANow we are going to send a string that is composed by 128 characters repeated, concatenated to some bytes.
python3 -c 'print(128*"A"+"\x20\xe0\xff\xff\xff\x7f\x00\x00\xb7\x05\x40\x00")' |./vuln1As result you will see:
If I am printed, I was hacked! because the program never called me!
Segmentation fault (core dumped)
What just happened? We simply sent a string, and a function that is never called in the program was called… We can send some particular input to the program to break it and make it do something that we want. That "particular input" you send to a program in the security jargon is called the "payload".
You just hacked a very simple binary. But… what happened on the inside? Why? A very rough explanation, is that when you call a function, the computer needs to know how to come back to continue executing the code that called it after the function finishes its execution. The address of the piece of code that you should continue on after the function call (you do not see this in the source code), is called the return address. Since the program is not checking the boundaries of the input in the C program we made, you can overwrite the place in which the return address is stored! Let’s understand that better so you can manipulate similar exploits at your will.
7.3. What you need to know for a binary exploit
The famous Stack Overflow is a type of Buffer Overflow, an anomaly that overwrites a memory sector where it should not. It causes security problems by opening doors for malicious actions to be executed. To understand it, it is necessary to have an idea of how the memory of a computer works.
7.3.1. Memory
RAM means "random access memory". It is called Random Access because you can access any part of it directly, without having to pass first for other regions, as it was necessary at some point in history. For example, computers used to have a magnetic tape in which an item of data could only be accessed by starting from the beginning of the tape and finding an address sequentially. In a RAM we can go to any part of it immediately!
Conceptually, a RAM is a grid with slots that can contain data. Let’s imagine we have a RAM of only 5 slots. We could name each slot by a number, starting at 0, so it would look like this:
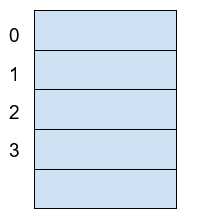
Now, if we want to put the word "HELLO" in our imaginary memory, we could put each character of "HELLO" in each slot, like this:
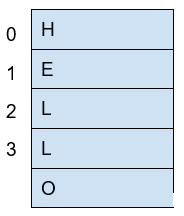
The numbers we used to identify each slot of the memory are called addresses. If we ask: what character is in the address 1? The answer would be the character ‘E’. A real memory from a computer nowadays can have billions of addresses. Normally, addresses are shown in hexadecimal. For example, the address "255" would normally be shown as "0xFF".
In a program, the memory is used in a certain way to be able to do all that the program can do, and the program itself is present in memory when it is being executed. The memory is organized in the following sections:
When we compile a C source code, this is converted to machine code also known as binary. When a program is run, this machine code is placed in the code section. The code section holds only machine code, not the source code we know from C for example. The machine code is a set of instructions that the processor of a computer can understand. The computer will execute the instructions sequentially and while doing that will access other parts of memory to read data and output results.
A program has several sections, but for now, let’s keep in mind the following three sections:
-
Data section
-
Heap
-
Stack
In the data section, static and global variables are placed. This variables always exist when the program is being run, in contrast to local variables that disappear when a function finishes and returns the result.
In the heap is placed the memory allocated dynamically. For example, when you use malloc in C to allocate a buffer, that buffer is allocated on the heap. It is called dynamic allocation because the program allocates memory when is already running and executing the particular instruction for malloc. In the code you write you can also decide to deallocate a buffer of memory that you previously allocated. So, it is called dynamic because the programmer can allocate it and deallocate a chunk of memory of a desired size.
In the Stack segment, are placed the local variables, function parameters and return addresses. What is a return address? When we call a function, the address of the next instruction has to be stored somewhere so the program knows where to comeback after the function is finished. We call this address the "return address". A function can be called in different parts of a program, so this return address will be different depending on where the program calls the function.
7.4. Example of Execution of a program
The execution of a program and its memory is controlled by processor registers, usually called simply registers. These are a very small and fast kind of memory that is attached to the processor. A register can store 4 or 8 bytes, depending on the processor. A processor only has a few registers. Depending on the kind of processor, the registers might differ. But we will take a look at the ones that are generic to most processors and will let us understand later the most common binary exploits.
To see a real example in action we can use GDB, a software that allows us to see the execution of each part of a programs and its memory step by step. This kind of software is called a debugger. When a binary program is running and we debug it, we can see in detail what the program is doing in memory by analyzing the Assembly. What is the Assembly? It is a low level language that can be used to show what each instruction from the machine code does. GDB can generate assembly from the machine code in memory while we are debugging the program so we can easily see what the machine code is doing.
7.4.1. GDB, Assembly and machine code
In the webshell, GDB is already installed, so you can run
gdb ./vuln1You should see something like this:
GNU gdb (Ubuntu 8.1-0ubuntu3) 8.1.0.20180409-git
Copyright (C) 2018 Free Software Foundation, Inc.
License GPLv3+: GNU GPL version 3 or later <http://gnu.org/licenses/gpl.html>
This is free software: you are free to change and redistribute it.
There is NO WARRANTY, to the extent permitted by law. Type "show copying"
and "show warranty" for details.
This GDB was configured as "x86_64-linux-gnu".
Type "show configuration" for configuration details.
For bug reporting instructions, please see:
<http://www.gnu.org/software/gdb/bugs/>.
Find the GDB manual and other documentation resources online at:
<http://www.gnu.org/software/gdb/documentation/>.
For help, type "help".
Type "apropos word" to search for commands related to "word"...
Reading symbols from vuln1...(no debugging symbols found)...done.
(gdb)
Now, input "run" and press enter. Remember to press enter after using a command. The program "vuln1" will be executed, so you can enter any string and it will print it back, as it normally does the program "vuln1". You should see something like this if the string you input is "HelloPicoCTF":
(gdb) run
Starting program: /vuln1
Input a string and it will be printed back!
HelloPicoCTF
HelloPicoCTF
[Inferior 1 (process 95000) exited normally]
(gdb)
If you input "r" instead of "run", it will do the same because "r" is the GDB abbreviation for "run". If you do the experiment you should see the same:
(gdb) r
Starting program: /vuln1
Input a string and it will be printed back!
HelloPicoCTF
HelloPicoCTF
[Inferior 1 (process 95000) exited normally]
(gdb)
To exit from GDB, you can input "quit" and press enter. Also, you could input only "q" and it will quit too. In several GDB commands, you can also input the first character of the command, and GDB will understand.
Now, open GDB again to debug "vuln1" with the same command we used previously:
gdb ./vuln1But now, before running it using "run", we want to stop at the beginning of the function "vuln()". To do this, you can set a breakpoint at vuln(). Setting a breakpoint, simply means that the execution of the program will pause in the instruction you set the breakpoint. By running "break vuln" or "b vuln", a breakpoint will be set at the beginning of vuln. We will see this:
(gdb) b vuln
Breakpoint 1 at 0x4005ce| The addresses you see might be different, that is ok. |
What does it mean "Breakpoint 1 at 0x4005ce" ? Do you remember that there is a segment of the memory in which the machine code is placed? In the memory address "0x4005ce" the machine code of "vuln()" begins. Input "r" to start the execution of the program and you will see:
(gdb) r
Starting program: /home/samuel/Desktop/problems/vuln1
Breakpoint 1, 0x00000000004005ce in vuln ()
(gdb)
"Breakpoint 1, 0x00000000004005ce in vuln ()" means that the first break point we have set, was established at address "0x00000000004005ce", which is the same address as "0x4005ce"; An address is a number in this case, so zeros at the left cause no effect. Note that in other cases, zeros at the left can have an effect if what we are reading is not being interpreted as a number.
Processor registers
A program is made up of several instructions that are executed sequentially. The processor of the computer has an integrated and very small memory different from RAM, called the "registers". A processor only has a few registers. Each register can hold only 8 bytes in a 64 bit processor, and 4 bytes in a 32 bit processor. A 32 bit program can run on a 64 bit processor, but 64 bit program cannot run on a 32 bit processor. One of the registers is called the Instruction Pointer, abbreviated as IP, that keeps track of the part of the program that is currently being executed. In a 64 bit program, we can print the value of this register in GDB using "x $rip":
(gdb) x $rip
0x4005ce <vuln+4>: 0x80c48348
(gdb)
Note that the first part of the line shown is "0x4005ce", this is exactly where the breakpoint was placed, so the IP naturally has that value because we made the program pause there. Then we have "<vuln+4>", do you remember we said that by setting a breakpoint at a function it would pause at the beginning of the function? To be more precise, a breakpoint on a function is usually placed 4 bytes after the beginning of the machine code of what is considered the function. That’s why the "+4". Later we will understand why it’s done like this. The remaining part, "0x80c48348", is the actual content at the address "0x4005ce". That content is a part of the machine code of the "vuln()" function.
To show the whole machine code of the function, showing each instruction on each address and its machine code, we can run "disas /r":
(gdb) disas /r
Dump of assembler code for function vuln:
0x4005ca <+0>: 55    push %rbp
0x4005cb <+1>: 48 89 e5    mov %rsp,%rbp
=> 0x4005ce <+4>: 48 83 c4 80    add $0xffffffffffffff80,%rsp
0x4005d2 <+8>: 48 8d 3d 27 01 00 00    lea 0x127(%rip),%rdi
0x4005d9 <+15>: e8 c2 fe ff ff    callq 0x4004a0 <puts@plt>
0x4005de <+20>: 48 8d 45 80    lea -0x80(%rbp),%rax
0x4005e2 <+24>: 48 89 c7 mov    %rax,%rdi
0x4005e5 <+27>: b8 00 00 00 00    mov $0x0,%eax
0x4005ea <+32>: e8 c1 fe ff ff    callq 0x4004b0 <gets@plt>
0x4005ef <+37>: 48 8d 45 80    lea -0x80(%rbp),%rax
0x4005f3 <+41>: 48 89 c7    mov %rax,%rdi
0x4005f6 <+44>: e8 a5 fe ff ff    callq 0x4004a0 <puts@plt>
0x4005fb <+49>: 48 8b 05 3e 0a 20 00    mov 0x200a3e(%rip),%rax
0x400602 <+56>: 48 89 c7    mov %rax,%rdi
0x400605 <+59>: e8 b6 fe ff ff    callq 0x4004c0 <fflush@plt>
0x40060a <+64>: 90    nop
0x40060b <+65>: c9    leaveq
0x40060c <+66>: c3    retq
End of assembler dump.
(gdb)
Each line of what was just printed by GDB is organized in three parts. Let’s analyze the following line to introduced machine code and assembly:
0x400602 <+56>: 48 89 c7 mov %rax,%rdi
The left part is the address "0x400602 <+56>". After the address some spaces are shown, then in the middle we find the machine code, that in this case is "48 89 c7". After some other spaces, we find the Assembly, which is "mov %rax,%rdi". Assembly is a low level language that can be directly mapped to the machine code. That’s why GDB can see some machine code in the memory and print for us the assembly that represents. A specific sequence of bytes in the machine code maps to an instruction of assembly. So, when a program is running and in memory is seen the sequence of bytes "48 89 c7" in the code segment, the computer knows that is some specific instruction and the processor has to do a specific action. Right now the intention is not to explain assembly in detail, but just for the sake of this example, know that "mov %rax,%rdi" moves the value of the register "rax" into the register "rdi". While the program is being executed by going forward in the code section of memory where the machine code is located, and it appears the sequence of bytes "48 89 c7", the processor knows that it has to copy the register "rax" into "rdi". Note that in the function, there are two parts in which appears the machine code "48 89 c7" and both have the same assembly.
Now, in this line:
⇒ 0x4005ce <+4>: 48 83 c4 80 add $0xffffffffffffff80,%rsp
do you see the arrow "⇒" at the left? That indicates the instruction in which we are. Next to it there is an address, that as expected, has the same value as the Instruction Pointer. Then there is the <+4> which we already explained, followed by the machine code "48 83 c4 80" at the address 0x4005ce… Hold on, what is going on? A few paragraphs ago we said that the machine code at that address was " 0x 80 c4 83 48" when we printed the Instruction Pointer using "x $rip". But now we say it is "48 83 c4 80". If you look closely, these are the same bytes but backwards. Let’s take advantage of this opportunity to explain "little endian".
19.2.1.3 Little endian
In most of the computers we use in everyday life, the numbers are interpreted as little endian. So when you read this from memory:
48 83 c4 80
It will be interpreted and shown as this:
80 c4 83 48
This is the case only for numbers. Addresses are numbers. In an attack when you want to overwrite an address, you have to consider this and input the bytes of the address backwards so they are interpreted in the correct manner. Why do computers do this? There are some reasons and consequences. In fact there are also reasons for using "big endian" which is using the bytes without inverting them. One argument commonly given for supporting little endian, is that some operations are easier to do. For instance, if you have a number, let’s say 255 in decimal, it would be 0xff in hexadecimal. If the number is contained in a variable type that takes 4 bytes, for example an "int" in C, it would look like this in memory:
ff 00 00 00
Then, you want to cast it to a type that only takes two bytes, for example a "short" in C. In memory, you can leave the same value without having to move anything, and the "short" would look like this:
ff 00
Now, imagine that we were not using little endian. The type "int" would hold the number like this:
00 00 00 ff
And the "short" like this:
00 ff
Note that we had to move the ff, which originally was on the fourth byte, and now it is in the second byte.
In summary, what you should remember for binary exploits, is that if you want to write a number into memory, you have to write its bytes backwards. Also, remember that this is only for numbers. In a hypothetical situation if you want to place in memory the string "HELLO", you can put it in its original order.
In GDB is possible to show a chunk of memory at a specific location using a command such as "x/16xw 0x4005da". This will print 16 words after the address 0x4005da. A word in a 64 bit processor, has 8 bytes, so that command is going to print 64 bytes. Run the command yourself! You should see something like this:
(gdb) x/16xw 0x4005ce
0x4005ce <vuln+4>: 0x80c48348 0x273d8d48 0xe8000001 0xfffffec2
0x4005de <vuln+20>: 0x80458d48 0xb8c78948 0x00000000 0xfffec1e8
0x4005ee <vuln+36>: 0x458d48ff 0xc7894880 0xfffea5e8 0x058b48ff
0x4005fe <vuln+52>: 0x00200a3e 0xe8c78948 0xfffffeb6 0x55c3c990
(gdb)
Note that GDB prints each group of 4 bytes as a numbers. Because of little endianess, each of those groups of 4 bytes, is reversed in memory. When using the previous command, no matter what is inside the memory, everything will be printed in reverse for each group of 4 bytes.
Function call
When a function is called, the IP moves to wherever the code of the function is located. When the function is finished, the IP moves back to the next instruction to the function call. As we mentioned previously, the address of the next instruction has to be stored somewhere so the program knows where to comeback after the function is finished. We call this address the "return address". The return address is stored in the memory segment refered as the stack. How do we know in which part of the stack? There is a register called the Stack Pointer (SP), that points to the tip of the stack. When a function is called, the stack pointer moves to make room for the return address and new local variables. When the function is finished, the Stack Pointer moves to the original position prior to the function call, making the memory addresses in which the local variables from the function were located free again.
Imagine that we have a toy memory with only a few addresses. Remember that the SP is the Stack Pointer, and the Stack is a region of memory, in this case colored in yellow. Suppose that we have created no local variables or anything on the stack. The stack would look like this:
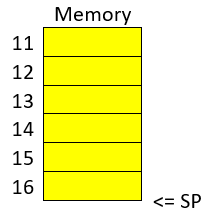
Then we create a local variable, using something like:
int var=4;After that is executed, the stack would look like in the following image, because by creating a variable we push it into the stack (in this example we are using “⇐” as a simple arrow):
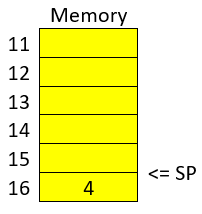
Note that when we push a variable into the stack, we subtract one address to the SP, so it points to the new top of the stack. In this case the new SP value will be 16, which means is pointing to the address 16. If we create another local variable like this:
int var=5;The stack would look like this:
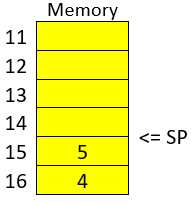
And the SP would be equal to 15.
In real life, on a 32 bit Intel architecture, each address contains four bytes. Integers are stored in little endian, and the addresses would have bigger values on a running program because the stack is placed on higher addresses. A piece of the stack that created two integer with values 5 and 4, could look like this (remember that address and memory are usually represented in hex):
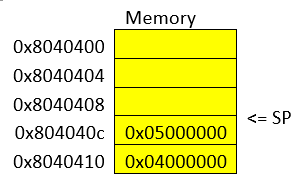
Let’s go now to real life on our 64 bit program.
In GDB, set a breakpoint in the function "main" using "b main":
(gdb) b mainAnd run the program again using "r"
(gdb) rThe program being debugged has been started already.
Start it from the beginning? (y or n) y
Starting program: /vuln1
Breakpoint 2, 0x0000000000400611 in main ()
(gdb)
To show the assembly of the current function in where we are, which is "main", use "disas":
(gdb) disas
    Dump of assembler code for function main:
    0x000000000040060d <+0>: push %rbp
    0x000000000040060e <+1>: mov %rsp,%rbp
 => 0x0000000000400611 <+4>: sub $0x10,%rsp
    0x0000000000400615 <+8>: mov %edi,-0x4(%rbp)
    0x0000000000400618 <+11>: mov %rsi,-0x10(%rbp)
    0x000000000040061c <+15>: mov $0x0,%eax
    0x0000000000400621 <+20>: callq 0x4005ca <vuln>
    0x0000000000400626 <+25>: mov $0x0,%eax
    0x000000000040062b <+30>: leaveq
    0x000000000040062c <+31>: retq
End of assembler dump.
Even if you don’t know assembly, if you look through it, you might guess that "callq 0x4005ca <vuln>" is the function call to "vuln". We will go to that instruction in the debugger. To advance one instruction in GDB we can use "si". Try it, and use "disas" again to see where we are now. You should see something like this:
(gdb) si
    0x0000000000400615 in main ()
    (gdb) disas
    Dump of assembler code for function main:
    0x000000000040060d <+0>: push %rbp
    0x000000000040060e <+1>: mov %rsp,%rbp
    0x0000000000400611 <+4>: sub $0x10,%rsp
 => 0x0000000000400615 <+8>: mov %edi,-0x4(%rbp)
    0x0000000000400618 <+11>: mov %rsi,-0x10(%rbp)
    0x000000000040061c <+15>: mov $0x0,%eax
    0x0000000000400621 <+20>: callq 0x4005ca <vuln>
    0x0000000000400626 <+25>: mov $0x0,%eax
    0x000000000040062b <+30>: leaveq
    0x000000000040062c <+31>: retq
    End of assembler
We could use "si" three times more to get to the instruction in which the function call is made. But this strategy might not be good if we are far away from the function call. Instead, we can set a breakpoint on the memory address of the function call that we see is "0x0000000000400621". To set a breakpoint on a memory address, we also use "b", but we put an asterisk previous to the address like this "b *0x0000000000400621", after pressing enter you should see something like:
(gdb) b *0x0000000000400621
Breakpoint 3 at 0x400621
(gdb)
Now, use "continue" or "c" to continue to the breakpoint:
(gdb) c
Continuing.
Breakpoint 3, 0x0000000000400621 in main ()
(gdb)
Now, verify that we actually get to where we wanted using "disas":
(gdb) disas
    Dump of assembler code for function main:
    0x000000000040060d <+0>: push %rbp
    0x000000000040060e <+1>: mov %rsp,%rbp
    0x0000000000400611 <+4>: sub $0x10,%rsp
    0x0000000000400615 <+8>: mov %edi,-0x4(%rbp)
    0x0000000000400618 <+11>: mov %rsi,-0x10(%rbp)
    0x000000000040061c <+15>: mov $0x0,%eax
 => 0x0000000000400621 <+20>: callq 0x4005ca <vuln>
    0x0000000000400626 <+25>: mov $0x0,%eax
    0x000000000040062b <+30>: leaveq
    0x000000000040062c <+31>: retq
    End of assembler dump.
    (gdb)
At this point, the program is about to execute the function call to "vuln()". Remember that the return address is the next instruction to the function call. Note that If it was the same as the function call, it would return and call the function again and get into an infinite loop
In this case, the return address is "0x0000000000400626", remember this address. If we check the Stack Pointer (SP) right now using "x $rsp" we would see that it points to an address that does not contain the return address yet:
(gdb) x $rsp
0x7fffffffe010: 0xffffe108
If we advance one instruction using "si", we would suddenly be in the first instruction of the function "vuln()":
(gdb) si
0x00000000004005ca in vuln ()
(gdb) disas
Dump of assembler code for function vuln:
=>  0x00000000004005ca <+0>: push %rbp
    0x00000000004005cb <+1>: mov %rsp,%rbp
    0x00000000004005ce <+4>: add $0xffffffffffffff80,%rsp
    0x00000000004005d2 <+8>: lea 0x127(%rip),%rdi # 0x400700
    0x00000000004005d9 <+15>: callq 0x4004a0 <puts@plt>
    0x00000000004005de <+20>: lea -0x80(%rbp),%rax
    0x00000000004005e2 <+24>: mov %rax,%rdi
    0x00000000004005e5 <+27>: mov $0x0,%eax
    0x00000000004005ea <+32>: callq 0x4004b0 <gets@plt>
    0x00000000004005ef <+37>: lea -0x80(%rbp),%rax
    0x00000000004005f3 <+41>: mov %rax,%rdi
    0x00000000004005f6 <+44>: callq 0x4004a0 <puts@plt>
    0x00000000004005fb <+49>: mov 0x200a3e(%rip),%rax
    0x0000000000400602 <+56>: mov %rax,%rdi
    0x0000000000400605 <+59>: callq 0x4004c0 <fflush@plt>
    0x000000000040060a <+64>: nop
    0x000000000040060b <+65>: leaveq
    0x000000000040060c <+66>: retq
    End of
And if we check the SP again:
(gdb) x $rsp
0x7fffffffe008: 0x00400626
(gdb)
Do you remember the return address was "0x0000000000400626"? We can see that the SP points to the address "0x7fffffffe008", and that address contains the return address!
The whole idea of the attack, is to modify the return address, to return at another place. In our attack example at the beginning, we modify it so it returned to the function "win()".
The function gets() in C, simply copies any user input and puts all that in memory, so we simply need to overwrite the return address. As a programmer, never use gets() in C, you would introduce a vulnerability in your program that is very easy to exploit!
8. The ICOA Competition Environment
| This chapter is a placeholder. Detailed information — including the full command reference, practice access, and recording requirements — will be published closer to the competition. |
8.1. Practising the Advanced Material
The ICOA practice environment at practice.icoa2026.au will host:
-
A full GDB-enabled Linux shell for binary exploitation practice.
-
Sample vulnerable binaries graduated by difficulty.
-
The Sleuthkit tools (
mmls,fls,icat) and other forensics utilities. -
Standard build tools (
gcc,make,objdump,readelf,strings,xxd).
Registered competitors will receive credentials and a tool reference ahead of the event.
8.2. Why CLI for Advanced Work
Most professional reverse engineers and exploit developers use a mix of GUI tools (IDA, Ghidra) and CLI tools (gdb, radare2, pwntools) in their daily work. The ICOA competition environment standardises on the CLI subset for three reasons:
-
Reproducibility — everyone has identical tooling, no licensed-software lottery.
-
Recordability — a terminal session is fully captured by the recording infrastructure.
-
Equity — competitors with low-bandwidth connections can participate without GUI latency penalties.
The skills in this guide map directly to the tooling that will be available.
8.3. What to Install Now
Before the competition, install on your local machine (or a Linux VM):
-
gdb(withpwndbgorgefextensions optional but recommended). -
gcc,make,binutils(objdump,readelf,nm,strings). -
python3andpip(forpwntools). -
xxd(usually bundled withvim).
These are pre-installed in the ICOA practice environment; installing them locally lets you start practising immediately.
8.4. What’s Coming
Future revisions of this guide will add:
-
Worked walkthroughs of past ICOA-style binary exploitation challenges.
-
AI-security-specific reversing examples (binary classifiers, model-serving binaries).
-
A companion ICOA GUI Guide for IDA, Ghidra, Wireshark, and Burp Suite workflows.
Check back before the competition for updates.